Resources · Farm operators
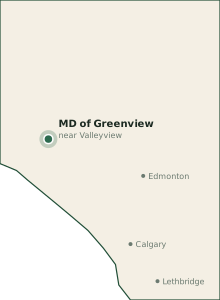
Farming in MD of Greenview, Alberta: Water, Wells and Frost-Free Days
If you run a working farm in MD of Greenview, four things set your season: how much water you can count on, how long the frost-free window is, which fields are wet or regulated, and what it costs to fix them. County figures are a starting point for a farm plan. They are not a parcel survey.
Cattle, hay, and some grain on the cleared land near Valleyview and DeBolt, with forestry and gas dominating elsewhere. Remote quarters depend on resource roads for access.
Well depth and water table for farm operators
Nearby well records suggest completed wells around 50 m deep in MD of Greenview, with static water levels often in the 8–25 m range. The predominant aquifer on file is Wapiti Formation sandstone and surficial sand aquifers. The depth and static-level figures are regional estimates from typical Alberta well records in this belt, not a surveyed water table on your parcel.
Greenview spans farmland around Valleyview to the mountains at Grande Cache, so one well number is a rough guide at best. Wapiti sandstone wells are deep and often sodium-rich; sand lenses near Sturgeon Lake give shallower water.
For livestock, plan for peak summer demand and for winter freeze-up. For irrigation, a well rarely replaces a licensed surface source, and diverting water for irrigation generally needs a Water Act licence. Only a pump test tells you yield, and a county average does not.
- Livestock: a frost-free pasture waterer keeps cattle off dugout and creek edges all winter.
- Irrigation: compare center pivot irrigation with general agricultural irrigation before you commit.
- Deeper background: water table in MD of Greenview.
Frost-free days and hardiness zone
MD of Greenview is generally treated as hardiness zone 2b, with a frost-free window on the order of 95 days. The zone and frost-free-day figures are county-scale estimates from published Canadian hardiness maps and climate normals, not a logger on your fence.
Zone 2b to 3a with a frost-free window around 95 days. Summer days are long, but frost risk never fully leaves.
Match variety maturity to the shorter, colder number, not the longer one. After an early harvest, a cover crop needs seed in the ground fast, and a 4R nitrogen plan helps you time inputs to the season you actually get. More on the zone: hardiness zone in MD of Greenview.
Wetlands, sloughs, and flood limits on the field
Wetland density in MD of Greenview is best described as high. Notable mapped or commonly discussed flood-hazard areas include Little Smoky River, Smoky River valley, Sturgeon Lake shoreline.
Muskeg and boreal wetlands cover most of the MD outside the farm belt. Draining is regulated and usually impractical; build on the ridges.
Alberta regulates changes to wetlands and watercourses. Draining, filling, or ditching a wet area can require approval under the Water Act, even when it looks like a low spot in a field. Read the Alberta wetland policy guide before you order a ditcher, and price field drainage only after you know what is allowed.
Work packages farm operators ask about
- Rotational grazing cross-fencing and livestock fence
- Cattle handling system
- Grain bin installation
- Manure storage system
- Soil restoration
Check grant fit before you spend
Alberta's producer programs run through Sustainable CAP, with streams for water, landscapes, efficiency, and value-added work. The federal On-Farm Climate Action Fund has supported nitrogen management, cover crops, and rotational grazing. Rates, caps, and intake change, so use the grant eligibility quiz to see what may apply, then confirm with the program administrator.
Sampled data for MD of Greenview
From a Land Intelligence report run on a representative quarter in Township 68, Range 26, W5. These are measured or record-based values for that location, shown to put the county figures above in context. They are not your parcel.
Growing zones near MD of Greenview: Grande Prairie (zone 3a) · Alberta growing zones map
Neighbouring counties: County of Grande Prairie (78 km) · Birch Hills County (94 km) · MD of Smoky River (97 km) · Big Lakes County (100 km) · Compare MD of Greenview with another county
Sampled from the live report pipeline at a representative quarter in Township 68, Range 26, W5 on 2026-10-08: solar irradiance (12 well records within 5 km). Kept as regional estimates: well depth (only 12 nearby records at the sample point); hardiness zone (point sample read 3b, more than a half-zone from the regional label). Text reviewed 2026-10-09. Methodology.
Common questions
How deep are farm wells in MD of Greenview?
Nearby records point to roughly 50 m as a planning figure. Your parcel can differ a lot, so a pump test matters more than the county average.
How long is the growing season in MD of Greenview?
Plan around about 95 frost-free days, then check your own field for frost pockets and shorter windows.
Do I need approval to drain a wet field in MD of Greenview?
Often, when a wetland or watercourse is involved. Confirm with Alberta Environment and Protected Areas before you dig.
Also for this county
- Well drillers serving MD of Greenview
- Septic installers serving MD of Greenview
- Solar installers serving MD of Greenview
- Fencing contractors serving MD of Greenview
- Excavation contractors serving MD of Greenview
- Search all providers serving MD of Greenview
- Tour a real report, screen by screen (Elk Island National Park)
- Alberta Resource Economics Atlas: subsurface geology, mines and mineral projects
- Alberta grant program guide and dates calendar