Resources · Water
Acreage guides for towns in this county: Taber
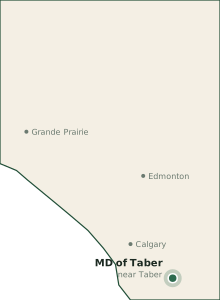
How Deep Is the Water Table in MD of Taber?
Buyers ask this before they bid, and drillers ask it before they quote. In MD of Taber, nearby well records point to an average completed well depth of about 12 m, with static water levels often in the 2–5 m range. The predominant aquifer on file for this part of Alberta is the Foremost and Oldman Formation sandstone with buried-valley sands.
Those numbers are county-scale context. They are not a promise for the quarter you are walking. These figures come from a Land Intelligence report run on a representative quarter in the county (SW 12-10-16-W4; 74 provincial well records within 5 km), not from your parcel.
Taber is corn-and-potato country under irrigation, and most farms depend on district water. Domestic wells into Belly River Group sandstones are moderate in depth with variable chemistry; many acreages are on district pipelines.
What a “water table” number actually is in MD of Taber
Around Taber and the rest of MD of Taber, people use “water table” for three different things:
- Static water level — the resting height of water in a completed well, measured from ground surface.
- Completion depth — how far the driller had to go to find a usable interval.
- Seasonal high water — how close water sits to the surface in a wet year, which matters for basements, septic, and dugouts.
A listing that says “good water at 80 feet” is usually mixing those ideas. Eighty feet of steel is a completion depth. The pump may still hang much shallower if the static level is high. Or the well may be deep and the static level may still sit far down the hole in late summer.
In MD of Taber, treat 12 m as a planning band for completion, and 2–5 m as a planning band for static level. If a seller’s story sits far outside both bands, ask for the well ID and the last pump test.
What this means before you drill in MD of Taber
Budget three line items on a MD of Taber acreage, not one:
- Drilling and casing to a depth that can overshoot the neighbour’s well. In this county, planning around 12 m plus a contingency is more honest than copying the shallowest well on the road.
- A pump test, not a “we hit water” photo. Yield, drawdown, and recovery decide whether the well is a household supply.
- Water chemistry. Iron, hardness, sulphur, and bacteria are independent of depth. A cheap shallow well can still need treatment.
The Foremost and Oldman Formation sandstone with buried-valley sands is common in this part of the province, but contacts shift. A buried-valley sand and a bedrock sandstone can sit under adjacent quarters. That is why a free parcel report that plots nearby well records is worth more than a single county average.
Flood and surface water are a separate file. In MD of Taber, notable mapped or commonly discussed hazard areas include Oldman River valley, Taber Irrigation District canals, Chin Coulee reservoir. A wet corner of a field is not automatically a well. It may be a wetland, a flood fringe, or both.
Reading a well record in MD of Taber
Alberta well reports usually list location, date, lithology, completion interval, static level, and a test rate. When you pull neighbours near Taber:
- Prefer wells within a kilometre, then compare geology, not just depth.
- Ignore abandoned holes unless you want to know where not to drill.
- Note the year. A 1978 farm well and a 2019 domestic well are not the same construction standard.
- If three nearby wells finish near 12 m and one is 15 m, ask why. The shallow one may be a sand point, a dugout well, or a different aquifer.
Permits, setbacks, and the rest of the MD of Taber water file
A new well in MD of Taber is only one approval. Earthworks for a pond, a dugout, or a crossing can trigger the Water Act. Mapped wetlands near Taber and across MD of Taber are common enough that you should not assume a “just a slough” story. Keep well planning and wetland planning in two piles so a good aquifer does not talk you into filling a regulated wetland.
See this for your specific parcel
County averages help you decide whether a listing is in the right universe. They cannot replace a pin on the map.
Generate a free land report for a property in MD of Taber →
The report is built to show water context, nearby records where available, and the other pillars — terrain, wetlands, climate, vegetation — on the same parcel.
Sampled data for MD of Taber
From a Land Intelligence report run on a representative quarter in Township 10, Range 16, W4. These are measured or record-based values for that location, shown to put the county figures above in context. They are not your parcel.
Neighbouring counties: Lethbridge County (48 km) · County of Warner (55 km) · County of Forty Mile (65 km) · County of Newell (91 km) · Compare MD of Taber with another county
Sampled from the live report pipeline at a representative quarter in Township 10, Range 16, W4 on 2026-10-08: well depth, hardiness zone, solar irradiance (74 well records within 5 km). Text reviewed 2026-10-08. Methodology.
Common questions
Is MD of Taber a good place to drill a well?
Many rural parcels in MD of Taber use private wells. Whether yours is “good” depends on the aquifer interval, chemistry, and a pump test — not the county average.
Can I use the neighbour’s well depth in MD of Taber?
Only as a hint. Geology can change between quarters. Pull the well ID and lithology before you copy a depth into a budget.
Also for this county
- Acreages near Taber
- Well drillers serving MD of Taber
- Septic installers serving MD of Taber
- Solar installers serving MD of Taber
- Fencing contractors serving MD of Taber
- Excavation contractors serving MD of Taber
- Search all providers serving MD of Taber
- Read a real report (Crown land, Strathcona County)
- Alberta Resource Economics Atlas: subsurface geology, mines and mineral projects
- Alberta grant program guide and dates calendar