Resources · Climate
Acreage guides for towns in this county: Lethbridge
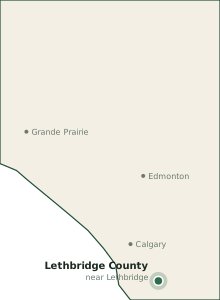
Hardiness Zone in Lethbridge County
Lethbridge County is generally treated as Canadian plant hardiness zone 4b, with a frost-free window on the order of 130 days. The zone is read from the Natural Resources Canada plant hardiness map (4th edition, 1991–2020 normals) at a representative quarter; frost dates are a regional table keyed by zone, not a logger on your fence. Those two numbers decide more tree deaths than soil tests do.
Zone 4a with about 125 frost-free days and chinook winters that swing from thaw to deep cold. Heat units support corn, beans, and sugar beets under irrigation.
What the zone is — and is not
Agriculture and Agri-Food Canada’s plant hardiness maps combine several climate variables, not just one winter low. A zone 4b label means a typical winter in this belt, not the worst winter of the decade, and not the frost pocket at the bottom of your driveway.
Use it to:
- Filter nursery stock (do not buy zone 5 peaches for a Lethbridge County field)
- Plan shelterbelts that will still be standing in twenty years
- Time cover crops against a 130-day window
Do not use it to:
- Ignore a north-facing draw
- Skip a thermometer logger for one season
- Assume the town of Lethbridge and a rural quarter share the same last frost
Frost-free days in practice
130 days is a regional sketch. Last spring frost and first fall frost move with elevation, wet ground, and cold-air drainage. In Lethbridge County, watch:
- River and lake edges that radiate heat at night — or collect cold
- Open peat or muskeg that frosts early
- South walls and gravel pads that buy you a week
A food forest that needs 130 days will fight this county most years. A shelterbelt of zone 4b natives will not.
Pair climate with water and sun
Zone is only one pillar. A 4b site with a 93 m well and 1.1 kWh/m²/day in winter is a different homestead than the same zone on a municipal line. Plan trees, wells, and panels on the same map.
Flood or wet ground near Oldman River valley, Little Bow River, St. Mary River Irrigation District canals can also shorten the effective season by keeping soils cold in May.
See this for your specific parcel
Generate a free land report for a property in Lethbridge County →
Sampled data for Lethbridge County
From a Land Intelligence report run on a representative quarter in Township 9, Range 21, W4. These are measured or record-based values for that location, shown to put the county figures above in context. They are not your parcel.
Growing zones near Lethbridge County: Lethbridge (zone 4b) · Taber (zone 4a) · Cardston (zone 4b) · Claresholm (zone 4a) · Alberta growing zones map
Neighbouring counties: County of Warner (46 km) · MD of Taber (48 km) · Cardston County (66 km) · MD of Willow Creek (73 km) · Compare Lethbridge County with another county
Sampled from the live report pipeline at a representative quarter in Township 9, Range 21, W4 on 2026-10-08: well depth, hardiness zone, solar irradiance (49 well records within 5 km). Text reviewed 2026-10-09. Methodology.
Common questions
What should I plant in Lethbridge County?
Start with zone 4b stock and a 130-day season. Then walk frost pockets.
Is the town of Lethbridge the same zone?
Often close, not identical. Elevation and cold-air drainage on a rural lot can run colder than town.
Also for this county
- Acreages near Lethbridge
- Well drillers serving Lethbridge County
- Septic installers serving Lethbridge County
- Solar installers serving Lethbridge County
- Fencing contractors serving Lethbridge County
- Excavation contractors serving Lethbridge County
- Search all providers serving Lethbridge County
- Tour a real report, screen by screen (Elk Island National Park)
- Alberta Resource Economics Atlas: subsurface geology, mines and mineral projects
- Alberta grant program guide and dates calendar